CyChecks
Lydia English, Yones Khaledian, Brianna Lawton, Gina Nichols, Stephanie Reinders
2019-05-09
Source:vignettes/name-of-cychecks.Rmd
name-of-cychecks.RmdIntroduction
The pay gap between men and women in various positions continues to plague many industries, including adademia. Publicly funded universities, like Iowa State University in Ames, Iowa, are mandated by law to publish the salary information of all their employees. This provides a unique opportunity to examine the pay patterns across various departments at a large academic instution. While other websites and databases exist to examine similar datasets or compare pay across universites, these resources often aren’t user friendly or don’t show the kind of interactive graphics users may wish to see. CyChecks, an R package, was created to change this. This package provides users with publicly available datasets in a tidy form and interactive web graphics to get them started, but it also allows the users to access the data they want so that they are able to apply any R functions they wish to see.
Package contents
- Datasets consistent of:
- Employee/salary/department dataset for 2007-2018
- Employee/salary/department/college dataset assumed to be valid for 2018
- Functions to:
- download data directly from the iowa.gov website
- anonymize names of downloaded data
- simplify professor position titles
- quickly identify departments with possible gender pay inequities
- Launch a Shiny App to help users explore the dataset provided in our package.
- A Shiny app for interactively, visualizing data
Datasets
The state of Iowa offers a large amount of public data at this site. You can access the data through the website, and it’s recommended that you sign up for an API token here if you’d like to scrape lots of data. Iowa state employee salaries are available at this site. CyChecks provides a function to easily get data for any given year through the above websites. The data from the government web site does not include the employee’s home department within the University, and a dataset consisting of the entire faculty and staff directory is not made publicly available. However, Iowa State Univerisity’s Human Resources Department kindly provided a list of employees with their home departments and associated colleges valid as of January 1st 2019. Since acquiring this information is not reproducible to the average user, we’ve included a full dataset (with names anonymized) of all salary info (from years 2007 to 2018) cross-referenced by department in the CyChecks package. Additionally, we’ve included a dataset of employee salary data and department information (again, with names anonymized) for fiscal year 2018. Since the directory information is only valid as of 2019, employees that had left before that year will not listed under their respective department in this dataset. This isn’t ideal, but a reality of trying to display University data.
Here is an example of a subset of one of our built in datasets - sals18. We are filtering by department (Agronomy) and position (Prof).
data("sals18")
sals18 %>%
  filter(department == "AGRONOMY" & position == "PROF") %>%
  select(gender, total_salary_paid, department, position, id) %>%
  head()%>%
kable()| gender | total_salary_paid | department | position | id |
|---|---|---|---|---|
| M | 105984.0 | AGRONOMY | PROF | d0c1b5af |
| M | 141439.1 | AGRONOMY | PROF | 8e137768 |
| M | 119634.0 | AGRONOMY | PROF | 8c54610e |
| F | 114736.0 | AGRONOMY | PROF | 08f1e76c |
| M | 132729.0 | AGRONOMY | PROF | 203b875b |
| M | 99764.0 | AGRONOMY | PROF | 325fa758 |
Functions
Function 1: Web Scraping (sal_df)
This function allows users to access salary information from the State of Iowa government, scraping that data from the web and converting it into a tibble for the user to examine. In the process of using this function, two columns from the original dataset have been deleted: department and base_salary. Department is “Iowa State University” for all rows, so it is redundant, and base_salary, while perhaps more useful in terms of examining what the University chooses to pay their employees, is a blank field for most rows and also consists of text entries when employees are paid by the hour, for example. Therefore we used total_salary_paid in all our subsequent figures and analyses, even though we know this metric can be mislading sometimes due to supplemented funded by summer grants, for instance.
While the user may enter their API as an argument to this function, having an API isn’t necessary for grabbing small amounts of data. Other arguments that the user can change include the number of rows in their datatable (limit), where those rows start (offset), and the year from which their data originates (fiscal_year).
ex <- sal_df(limit = 10, offset = 1100, fiscal_year = 2010) %>%
  select(-c(base_salary_date, travel_subsistence)) # trimming the dataframe so it's more easily readable
kable(ex, format = "html")| fiscal_year | gender | name | place_of_residence | position | total_salary_paid |
|---|---|---|---|---|---|
| 2010 | M | BYAMUKAMA EMMANUEL | STORY | POSTDOC RES ASSOC | 36000.00 |
| 2010 | F | BYARS JANA LENA | STORY | ASST PROF | 47280.00 |
| 2010 | M | BYERLY JOHN | MARSHALL | ARCHITECT III | 57307.48 |
| 2010 | M | BYERS JOHN LOUIS | STORY | CASUAL HOURLY | 1551.12 |
| 2010 | F | BYERS KAREN S | DICKINSON | CASUAL HOURLY | 6666.92 |
| 2010 | F | BYG ALTA JEAN | STORY | CLERK III | 40586.78 |
| 2010 | M | BYRD CHRISTOPHER JAM | STORY | CASUAL HOURLY | 1329.00 |
| 2010 | M | BYRD DAVID JOSEPH | BOONE | ASST SCIENTIST I | 45477.00 |
| 2010 | M | BYRD SCOTT GARRISON | STORY | CASUAL HOURLY | 1088.00 |
| 2010 | M | BYRD WILLIAM J | BOONE | PROGRAM DIRECTOR | 99543.89 |
Function 2: Anonymize names (anonymize)
This function allows the user to anonymize an aspect of the dataframe. While salary information is publicly available data, we also realize that this is sensitive, personal information and want to give the use the opportunity to anonymize something like names if they wish. In this function we can convert each individual’s name to an alphanumeric id to mask the individual’s real identity. The alphanumeric id is consistent across names so the user may still use a group_by function successfully, for instance. This function was used to anonymize all the datasets included in this package.
Here are some examples:
df_exmple <- data.frame("name" = c("Brianna","Gina","Lydia","Stephanie","Yones"),
                        "Salary" = c(5456, 5698, 5647, 5842, 5910)) # Create a dataframe
kable(df_exmple)| name | Salary |
|---|---|
| Brianna | 5456 |
| Gina | 5698 |
| Lydia | 5647 |
| Stephanie | 5842 |
| Yones | 5910 |
anon <- anonymize(df_exmple) # Anonymizing the column name

knitr::kable(anon, col.names = c("name" , "Salary", "Anonymous Name"))| name | Salary | Anonymous Name |
|---|---|---|
| Brianna | 5456 | c462a236 |
| Gina | 5698 | 1b9d8880 |
| Lydia | 5647 | 7509a610 |
| Stephanie | 5842 | 04d467d9 |
| Yones | 5910 | 0f22005a |
Function 3: Get professor info (get_profs)
This function creates a new data frame with professor positions grouped into 12 categories of simplified position titles. The function was created after the developers noticed that there were many varying titles of professor at the University, which made summarizing data difficult. get_profs() filters the position variable of the sals_dept dataset for any entries that contain the string ‘PROF’. Then it creates a new variable called position_simplified, which contains the simplified position category. The table below shows the string that is searched for in the position variable and the corresponding position_simplified category assigned to it. This function was created specifically to run on the sals_dept dataset. If the function is used on a dataset with different position abreviations than those listed in the table, the resulting data frame will be suboptimal.
| string | position_simplified |
|---|---|
| EMER | emeritus |
| DIST | distinguished |
| UNIV | university |
| MORRILL | Morrill |
| ADJ | adjunct |
| AFFIL | affiliate |
| VSTG | visting |
| ASST | assistant |
| ASSOC | associate |
| COLLAB | collab |
| CHAIR or CHR | chair |
| PROF | professor |
The following code runs the get_profs function on the sals_dept dataset and filters for associate professors. Only the first six rows are displayed.
| fiscal_year | gender | place_of_residence | position_simplified |
|---|---|---|---|
| 2007 | M | STORY | associate |
| 2007 | M | STORY | associate |
| 2007 | M | STORY | associate |
| 2007 | M | ROUTT | associate |
| 2007 | F | STORY | associate |
| 2007 | F | STORY | associate |
Function 4: Run basic statistics (stats_mf)
This function uses one fiscal year of data to identify departments with possible gender pay dispartities. Within a department, the function identifies positions that have more than 1 female and male in that position. Within a department, the function then fits a simple linear model of the following form:
total_salary ~ position + gender
The function then sorts the departments by the p-value associated with the gender term of the linear model, with the lowest p-values appearing first. The function then assigns a verdict, with a p-value less than 0.20 illiciting a ‘boo’ verdict, and a p-value higher than 0.20 earning an ‘ok’. While this may seem like a high p-value, we feel that 0.20 is an unliklely enough result to warrant further investigation. stats_mf() allows users to quickly filter and find departments with possible pay inequities associated with genders.
Figures produced with package contents
The following figures are used in the Shiny App to help the user visualize pay patterns.
The figure below demonstrates gender versus the total salary paid ($thousands) for different professor positions.
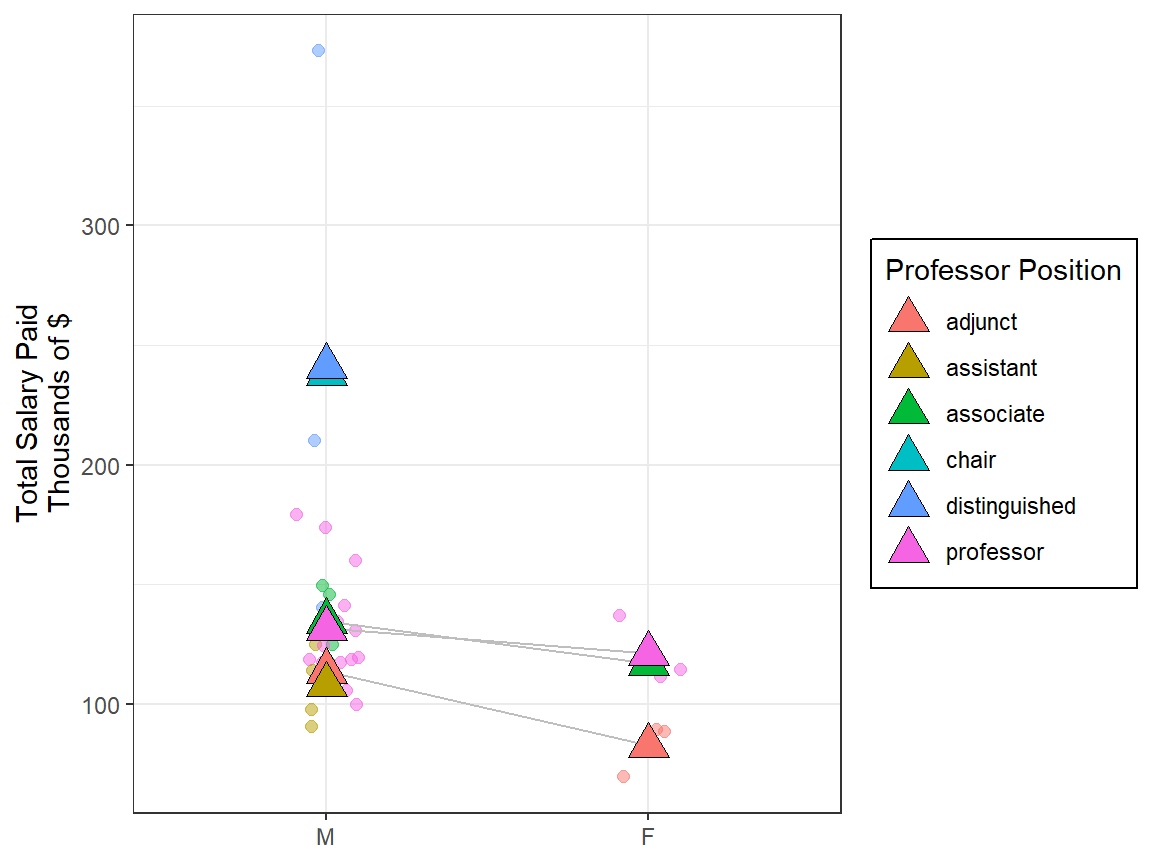
Professor 2018 salaries by gender and position in the Agronomy Department
From this figure you can see that only 3 of the 6 professor positions have both male and females respresented. The gray lines connect mean salaries of each position - you can quickly see there is a negative slope to the lines, indicating females in the same positions on average earn less than their male counterparts in the same positions. You can also see there are less dots in the female category, indicating there are more males in the professor positions compared to females. This type of graph is accessible in our Shiny App PROF tab.
An additional figure that looks at the gender make-up of departments is also included in the Shiny App.
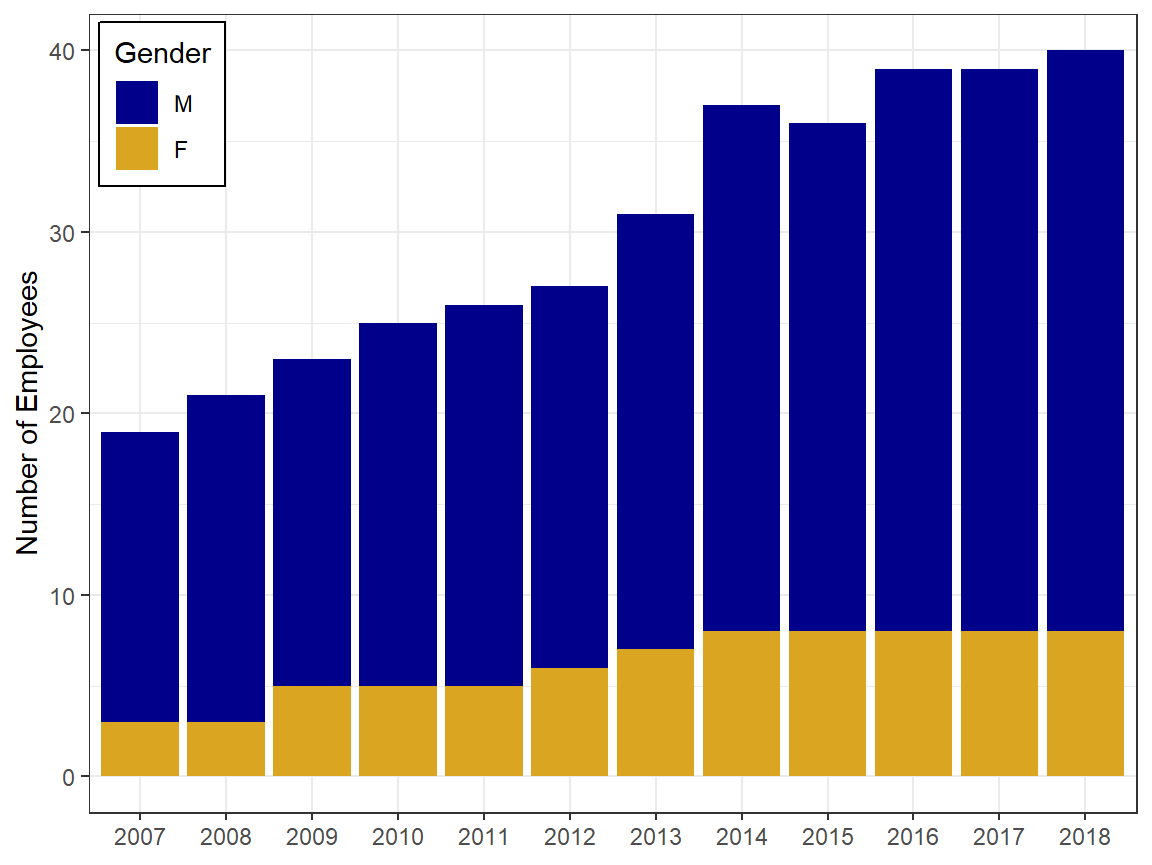
Number and gender of employees in professor positions in the Agronomy Dept. based on departmental affiliations in 2018
From this figure you can see the department has not hired a woman to a professor position since 2014. This is consistent with the previous figure, which showed there were no women in the ‘Assistant Professor’ position.
Shiny App
Feel free to check out the shiny app for this package by running the following code.
#runShiny()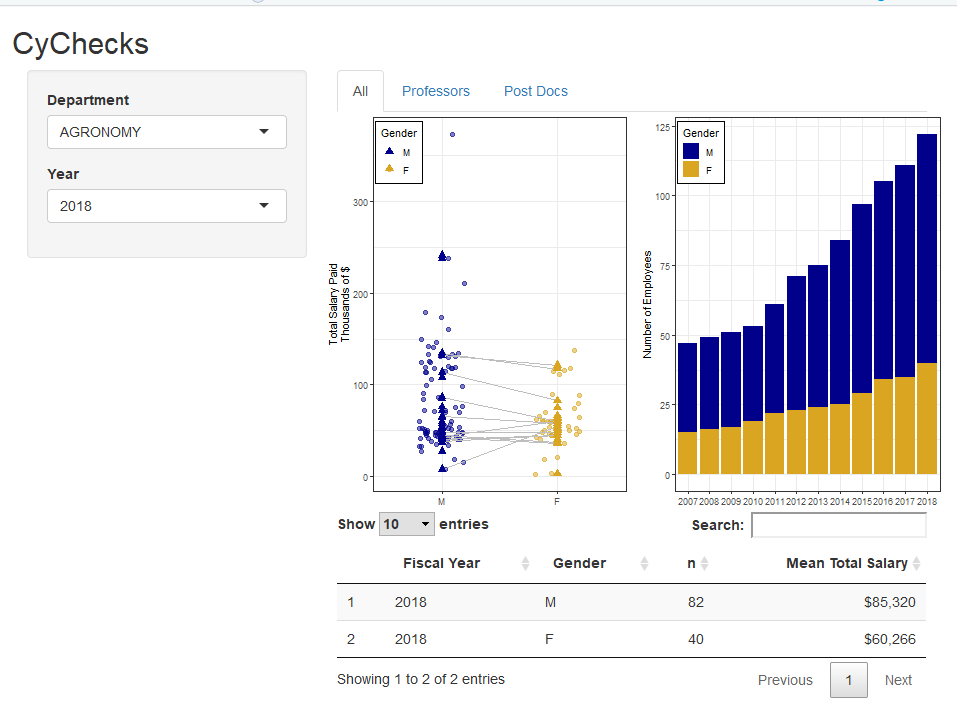
Conclusion
From the CyChecks package, the user is equipped with four different functions that can help them work through the above specified Iowa salary data in order to run analysis and cross-compare wages amoungst Iowa State University departments, while investigating gender and career position equity. This package, CyChecks, allows the user to scrape the dataset from the web, anonymize the names of invidivudals to mask identity for the sake of privacy, select and filter specific professor data, and run basic statistical analysis against the data for years 2007 to 2018.
Across the board, when graphically visualizing the data, it can be seen that there is a disparity between men and women’s average yearly salary in STEM departments (i.e. Agronomy, Engineering, Mathematics) where there is a defined scarcity in female representation across these departments’ academic professional careers (i.e. professor, assistance professor, professor emaritus, etc.). Conversely, some departments within the university, like the social sciences (i.e. education, language), are majority female. Either way, this data visualization can make it easier for users to understand and interpret the trends in the data, as well as identify where an initiative should be undertaken to close the pay gap within departments that lack diversity and gender representation at each position level.
Limitations & Future Work
We were only granted access to departmental affiliations for people employed by Iowa State University as of Jan 1 2019. If an employee left the university before that date, they will not be included in our dataset. This makes interpreting post-doctoral information particularly problematic, due to the transitory nature of that position. Despite these limitations, we believe this work opens the door to conversations about pay inequalities at ISU, and can serve as a resouce for individuals looking to negotiate starting salaries or request raises. Future work will include providing a way to quickly identify positions within a department that lack gender diversity, incorporating individuals who do not identify with one of the binary gender categories, and including a way to access departmental affiliations from the web.
Package Website/Vignette
Follow the link to checkout the CyCheck package to discover the pay pattern in your department!